

Edge vs Friction: When a Real Signal Still Loses
You can find a signal with a genuine, Wilson-backed edge — measured, non-repainting, real — and still lose money trading it. Not because the edge was fake, but because it was smaller than the cost of taking it. Spread, fees and slippage are a tax on every trade, and on fast timeframes that tax eats small edges whole. This is the lesson that ties the others together: gross edge is not net edge.
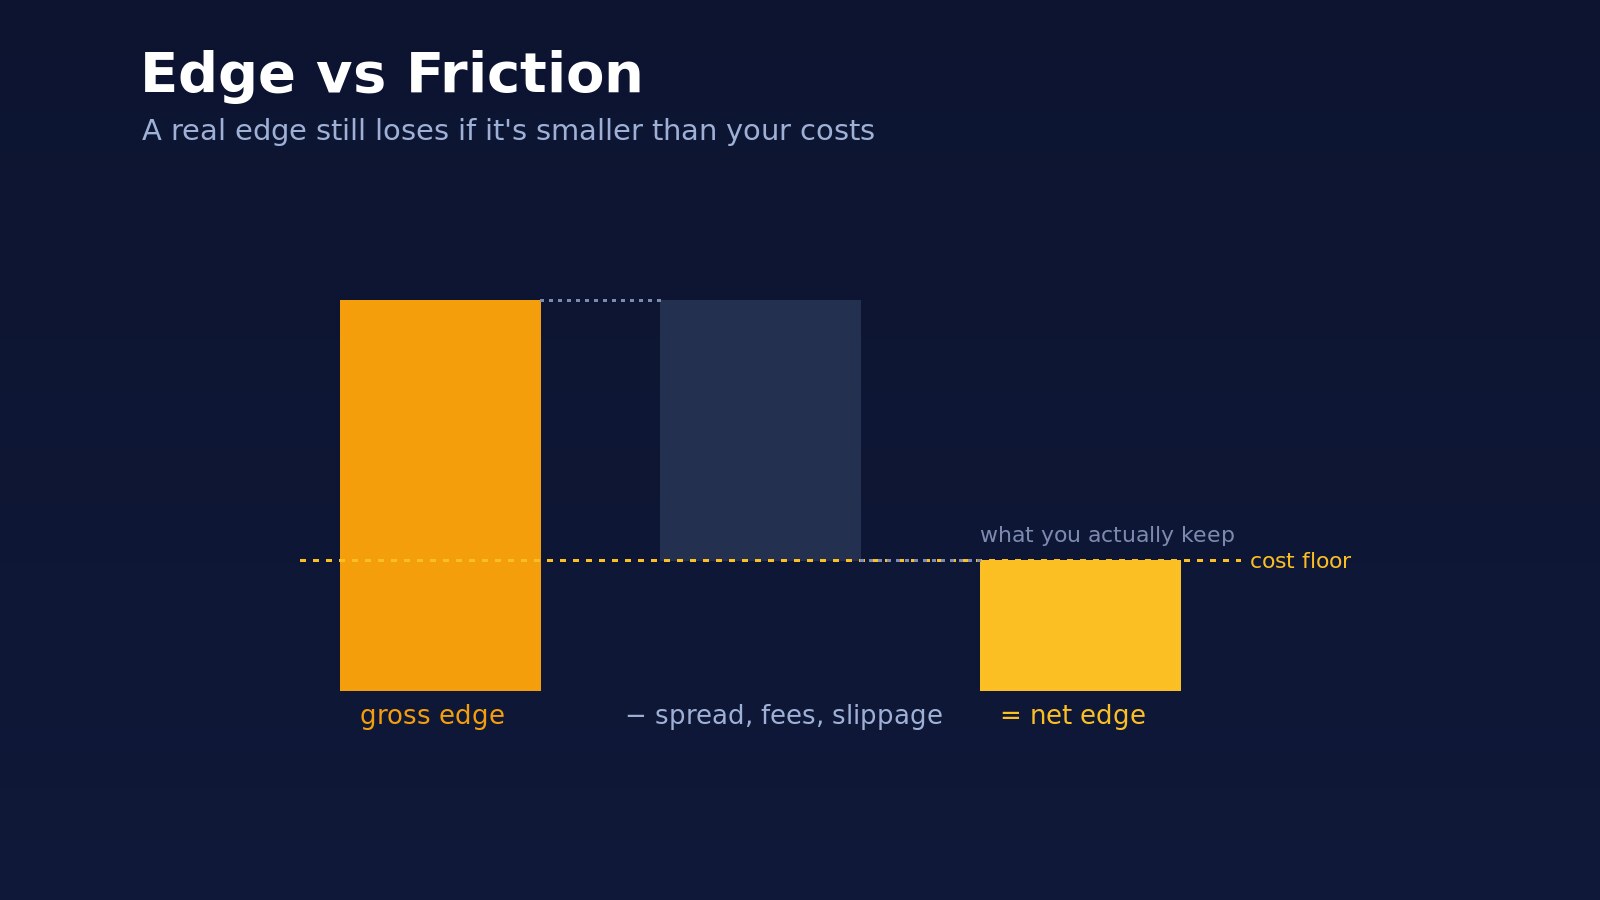
A Real Edge Is Not a Free Lunch
Every trade pays a toll before it can profit. There are three components:
- Spread — the gap between bid and ask you cross on entry and exit.
- Fees — exchange or broker commissions, both sides.
- Slippage — the difference between the price you wanted and the price you got.
These are not occasional costs; they apply to every round trip. A signal does not start at zero — it starts in the red by the size of its friction, and only the part of the edge above that line is yours to keep.
The Cost Floor
Put a number on it. Suppose a signal shows a Wilson-backed median forward return of +0.15% on a 5-minute chart. Genuine edge — the statistics are honest.
Now subtract reality: a spread of a few basis points each way, taker fees on both sides, a touch of slippage. On many liquid crypto pairs that round-trip friction lands somewhere near 0.1–0.2%. Your +0.15% gross edge is at, or below, the cost floor. You will trade it perfectly, the signal will be "right" as often as advertised, and your account will bleed sideways. The edge was real; it just was not yours.
Why Higher Timeframes Survive
Here is the asymmetry that decides everything: edge tends to scale with timeframe; cost does not.
The spread and fees on one round trip are roughly fixed whether you are trading a 5-minute move or a daily one. But a signal on the daily chart is reaching for a 2% move, not a 0.15% one. The same fixed friction that swallows a scalp is a rounding error against a swing. This is the real reason Probalist indicators are most reliable on higher timeframes (1H, 4H, Daily): not because the signals are smarter there, but because the edge clears the cost floor with room to spare.
Net Expectancy, Not Gross
The only number that pays you is net expectancy — average gross edge per trade, minus average cost per trade, times how often you trade.
Two traps fall out of that formula. First, a positive gross edge with negative net expectancy loses money no matter how good the signal looks. Second, trading more often multiplies your costs just as surely as your edge — a thin edge taken fifty times a day is fifty times the friction. Frequency is not free. The trader who takes three high-timeframe signals a week often keeps more than the one who takes thirty scalps a day at the same gross edge.
Reading the Bell Against Your Costs
This closes the loop with the first lesson in this course. When you read a signal's bell curve, do not read the median in isolation — read it against your own cost floor. Draw a mental line at your round-trip friction and ask whether the mass of the distribution, and the median, sit comfortably above it.
A backed signal whose median barely peeks over your costs is not a trade; it is a way to pay fees with extra steps. A backed signal whose median sits well clear of the floor, with the bulk of its distribution above it, is the one worth taking. Edge you cannot keep is not edge.